Functional Flow Analysis for the Sacramento River
EFF.RmdIncorperating Effective Functional Flows into R2R
The Reorienting to Recovery Structured Decision Making group proposed an effective functional flow (EFF) scenario. To date, there is no available CalSIM EFF run so we cannot model full EFF on the entire system. This document outlines our approach to piloting an EFF on the Sacramento River constructed to maximize salmonid survival, which differs from the California EFF.
Pilot EFF Approach on the Sacramento River
The R2R technical team met with a flow subgroup to determine the best way to model EFFs. The team started by looking at the Nature Conservancy’s Natural Flows Database to understand dynamics in the Upper Sacramento system. Acknowledging that modifying flows will only affect parts of the decision support model (DSM) that use flow-based relationships, we decided to use flow-to-habitat and flow-to-survival relationships to determine when and how much flow we wanted in the Sacramento river. We compared this to the Natural Flows tool and the Calsim 2019 BiOp to provide some comparison of total flow volumes in these scenarios. This produced a wet and dry year monthly EFF hydrograph, compiled into a 20-year synthetic time series based on the historical water year types represented in the R2R model time frame (1980-2000).
Planned Improvements and Next Steps
The technical team is working to review existing literature on pulse flows and expand pulse flow routing logic in the model. This will increase the granularity of flow related model effects despite the monthly timestep of our CalSim flow input data and the model.
The technical team is working with the COllaboratory for EQuity in Water ALlocations (COEQWAL) to incorporate EFF logic into a CalSIM run.
What is an EFF
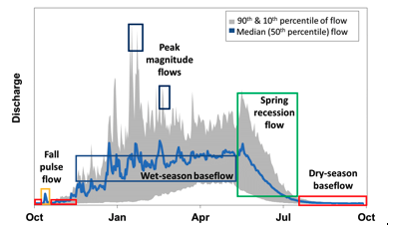
California’s EFF include 5 distinct components of a natural flow regime: fall pulse flows, wet season peak flows, wet season base flows, spring recession flows, and dry season baseflows.
For more information on EFF please refer to additional sources:
Tailoring EFF to our system
EFF are hypothesized to be the best flows for salmon in our historical system. However, our system is highly managed so we needed to alter the salmonid EFF to maximize benefit to salmon.
The R2R techncial team developed proposed EFF monthly flows by combining characteristics of the Natural Flows Database with critical flow to survival migratory thresholds on the Sacramento River (from Michel 2021).
This original attempt did not maximize habitat so the technical team revised their approach to maximize modeled habitat and survival using the following principles:
- Optimize spawning habitat during full spawning time frame (October, November, and December) based on the Upper-mid Sacramento flow-to-suitable-habitat curves documented here.
- Fix dry season base flow at a low value to maximize water for Juveniles, use Natural Flows Database as a guide (August, September)
- Optimize outmigration survival in last 3 model outmigration months (May, June, July). If water volume allows set migratory survival above 50%. If volume of water limited, set migratory survival above 20% (based on migratory survival flow survival thresholds on the Sacramento River (from Michel 2021).
- Utilize additional flows for maximizing FP habitat in (January, February, March & April)
Proposed Model EFFs
Wet Year EFF
The table below shows monthly flow EFF for a wet year model EFF on the Sacramento River. This table was constructed using the Natural Flows database and model survival thresholds.
| month | flow_cfs | description |
|---|---|---|
| Jan | 40000 | Utilize remaining water for FP habitat |
| Feb | 40000 | Utilize remaining water for FP habitat |
| Mar | 40000 | Utilize remaining water for FP habitat |
| Apr | 40000 | Utilize remaining water for FP habitat |
| May | 10700 | Optimize for migratory survival (10,700 for mig surv ~50%) |
| Jun | 10700 | Optimize for migratory survival (10,700 for mig surv ~50%) |
| Jul | 10700 | Optimize for migratory survival (10,700 for mig surv ~50%) |
| Aug | 1000 | Set at 1000 to incrase acreage for avaliable for Juv flows |
| Sep | 1000 | Set at 1000 to incrase acreage for avaliable for Juv flows |
| Oct | 4750 | Optimize for spawning habitat based on flow area WUA |
| Nov | 4750 | Optimize for spawning habitat based on flow area WUA |
| Dec | 4750 | Optimize for spawning habitat based on flow area WUA |
The plot below shows the CalSIM modeled flows for the Sacramento River of an existing representative wet year: 1996. 1996 has the median water year index as provided by DWR out of all the “Wet” and “Above Normal” years within our model time frame.
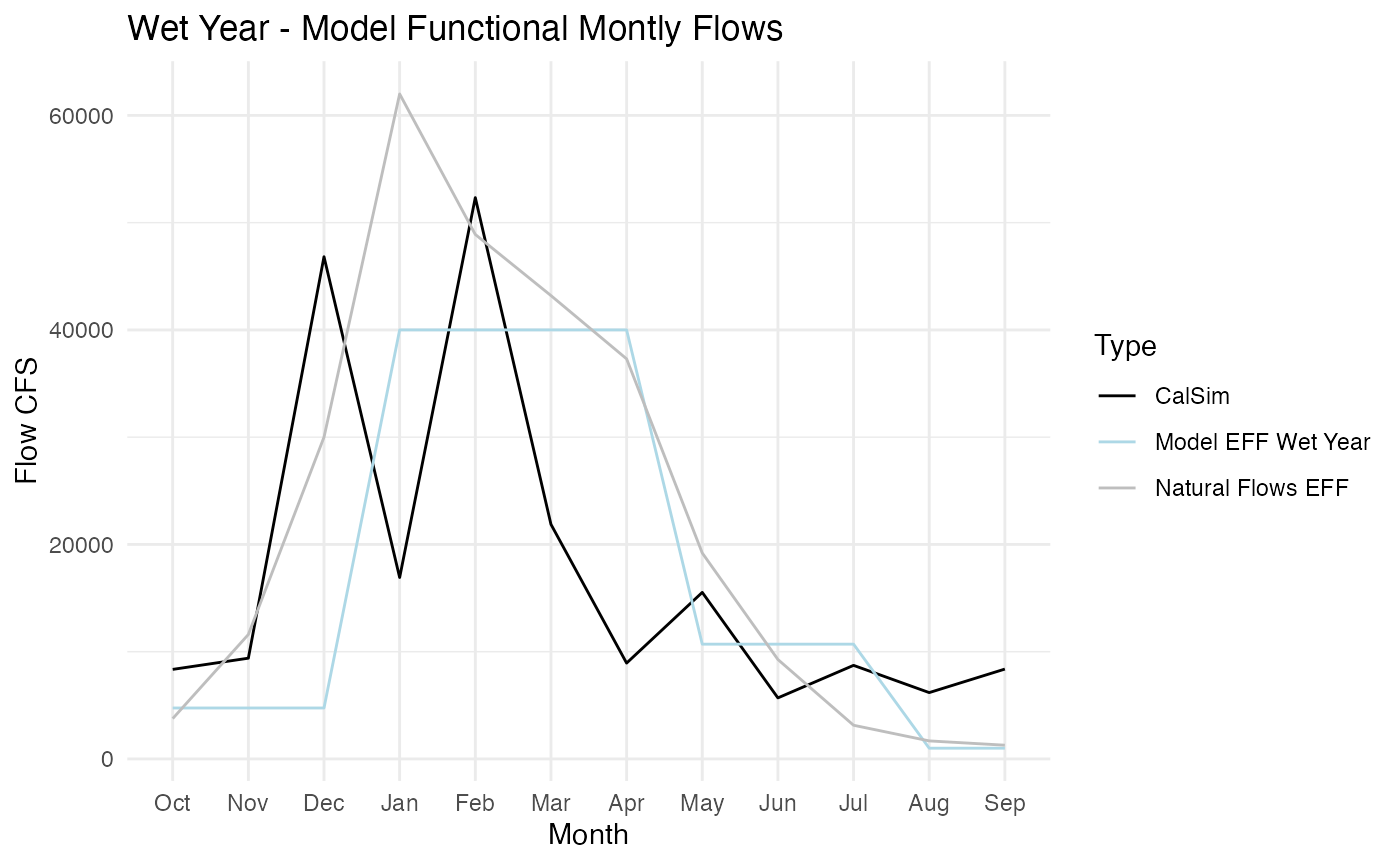
The table below shows the annual total volume of water needed for each flow scenario. The wet year EFF uses more water than the Natural Flows database EFF and then the representative CalSIM year.
| Scenario | Annual Acre Ft Water |
|---|---|
| Natural flows Database flows | 16380382 |
| Proposed Model EFF | 12578235 |
| calsim | 12625023 |
Dry Year EFF
The table below shows monthly flow CFS for a dry year model EFF on the Sacramento River. This table was constructed using the Natural Flows database and model survival thresholds.
| month | flow_cfs | description |
|---|---|---|
| Jan | 18500 | Utilize remaining water for FP habitat |
| Feb | 18500 | Utilize remaining water for FP habitat |
| Mar | 18500 | Utilize remaining water for FP habitat |
| Apr | 18500 | Utilize remaining water for FP habitat |
| May | 4500 | Keep high for migratory survival (4,350 for mig surv ~20%) |
| Jun | 4500 | Keep high for migratory survival (4,350 for mig surv ~20%) |
| Jul | 4500 | Keep high for migratory survival (4,350 for mig surv ~20%) |
| Aug | 500 | Set summer base flow to 550 based on Natural flows tool and to incrase acreage for avaliable for Juv flows |
| Sep | 500 | Set summer base flow to 550 based on Natural flows tool and to incrase acreage for avaliable for Juv flows |
| Oct | 4750 | Optimize for spawning habitat based on flow area WUA |
| Nov | 4750 | Optimize for spawning habitat based on flow area WUA |
| Dec | 4750 | Optimize for spawning habitat based on flow area WUA |
The plot below shows the CalSIM modeled flows for the Sacramento River of an existing representative dry year: 1987. 1987 has the median water year index as provided by DWR out of all the “Critical”, “Dry”, and “Below Normal” years within our model time frame.
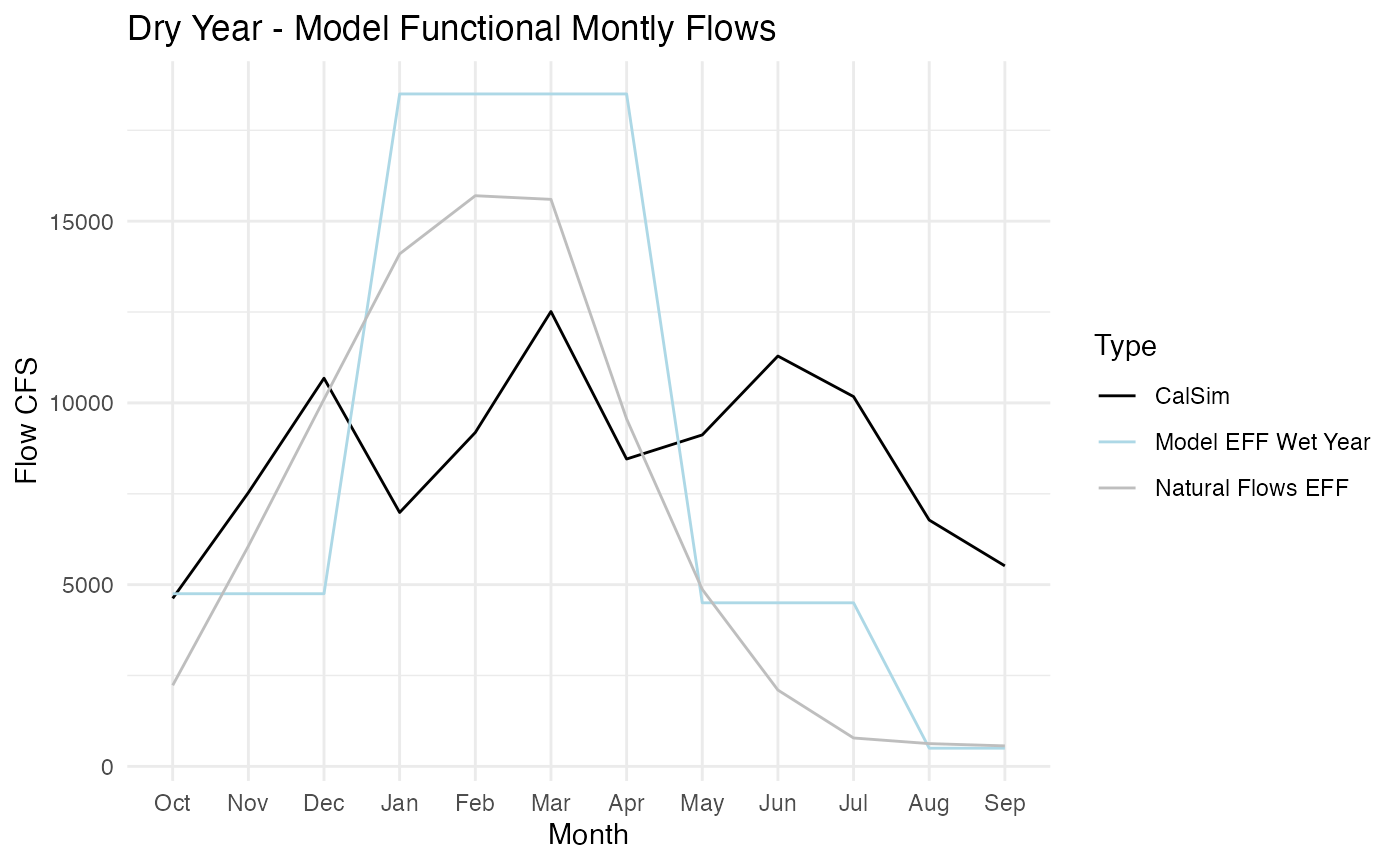
The table below shows the annual total volume of water needed for each flow scenario. The dry year EFF uses less water than the Natural Flows database EFF and than the representative CalSIM year.
| Scenario | Annual Acre Ft Water |
|---|---|
| Natural flows Database flows | 4967965 |
| Proposed Model EFF | 6203089 |
| calsim | 6208945 |
Creating a synthetic flow timeserries
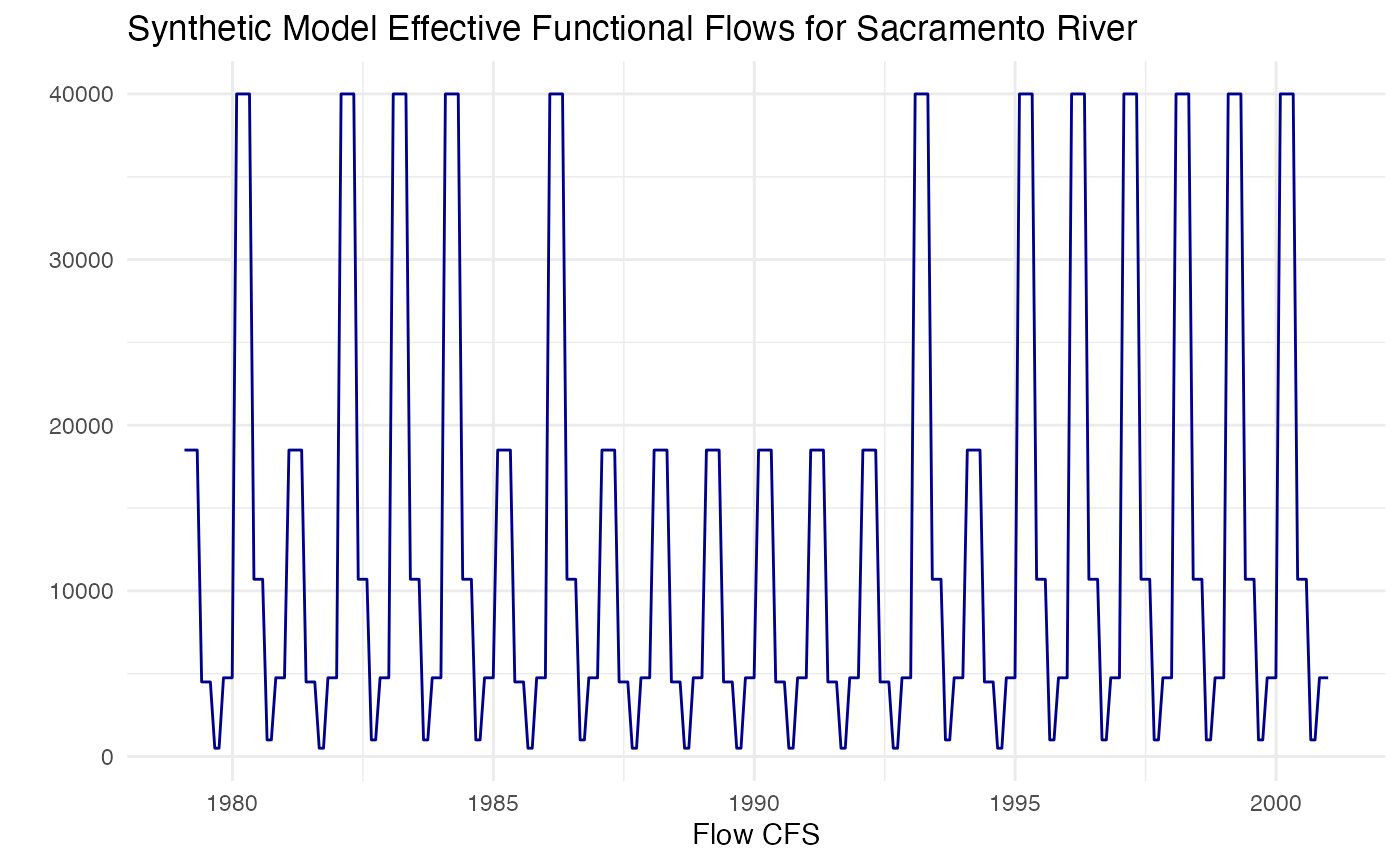
In order to incorporate these EFF into the model data inputs we combined wet and dry years to make a synthetic time series over the full 20 year period. We started by classifying years as “Dry” or “Wet” based on DWR water year type classifications. All “Dry”, “Critical”, or “Below Normal” years fall into the “Dry” category and all “Wet” or “Above Normal” years fall into the “Wet” category.
The plot below shows this synthetic time series for the Sacramento River over the 20 year simulation period.